Your opinion: in data

58,7% 655 responses
Thanks to your responses to the annual survey Satisquestion we can learn more about how you see the University and the possible improvements and future lines of work.
This course, the survey was conducted between April and May 2024. Out of 1,115 students, 655 responded, representing 58.7%. This is the edition in which the most students have participated since Satisquestion was first launched in 2019. It is also the second with the highest representativeness so far.
Below, we highlight the main data of this fifth edition, in which some of you participated in the 23-24 course:

4,05
Quality professor

3,43
Teaching organization

4,27
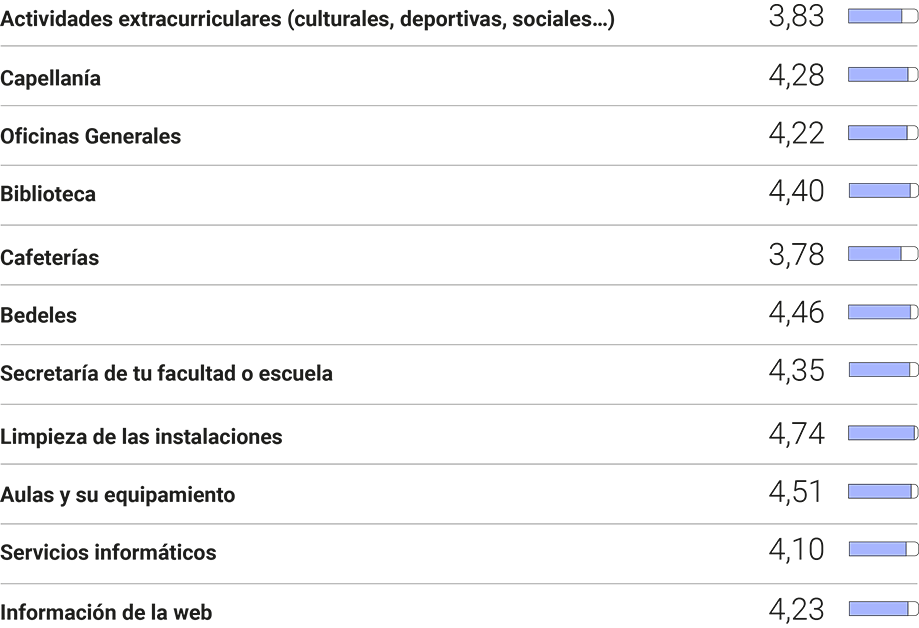
Services

3,86
University experience

4,15
Overall satisfaction
Ratings out of 5
1. Positive ratings
Among the most positive scores, the survey highlights: the cleanliness of the facilities (4.74 out of 5), the classrooms and their equipment (4.51 out of 5) and the attention of the staff (4.46 out of 5). With respect to the faculty, their availability and attention (4.21 out of 5), the promotion of the integral development of the student (4.02 out of 5), and the encouragement of interest in the subjects (3.99 out of 5).

2. Negative appraisals
Regarding the most negative marks, the survey indicates: the quality/price ratio of the programs (3.49 out of 5), the distribution of the load of work (3.31 out of 5) and the coordination between subjects (3.42 out of 5).

3. Comments
In this edition, 1,027 comments were received, of which 24% were positive, 55.36% negative and 14% neutral. With respect to the subject matter, those related to the quality of teaching are particularly noteworthy.


